
A Look at the 2016-2017 Virginia Adult Education Performance Data
by Heidi Silver-Pacuilla and Thomas Suh
The data is in for 2016-2017! This and future columns in the PROGRESS newsletter will examine the Virginia adult education performance data and raise questions for us to consider as practitioners.
As you read about the statewide reports and percentages, ask whether these represent your class and program. Chances are that they do not. The Commonwealth has regional distinctions that we see in our adult education programs. Talk to your colleagues and leaders about the data from your program. Whom do you serve? Which groups are making consistent gains? Can you help more people in your region achieve their goals?
Enrollment
In 2016-2017, we reported 19,208 students who had 12 hours or more of instruction (“participants” according to the National Reporting System [NRS]). This total enrollment figure is down from 20,221 in 2015-2016 and from 20,598 in 2014- 2015. Why do you think enrollment is on the decline?
Program Type
Figure 1 shows the percentage of participants in each program type, adult basic education (ABE), adult secondary education (ASE), and English as a second language (ESL). This chart shows that the largest number of students is served in our ESL programs. Do these percentages reflect your program’s population? If not, what would your pie chart look like?
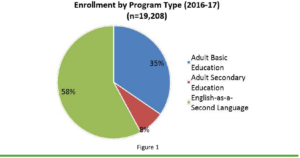
How to read this chart: Thirty-five percent of participants in program year 2016-2017 were served in adult basic education classes, seven percent were served in adult secondary education classes, and 58 percent were served in English as a second language classes.
Age
Figure 2 shows the percentage of participants in each age category, clearly demonstrating that the majority of participants served are of working age.
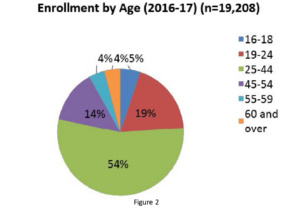
How to read this chart: Five percent of participants were ages 16-18 at intake, 19 percent were ages 19-24, 54 percent were ages 25-44, 14 percent were ages 45-54, 4 percent were ages 55-59, and 4 percent were age 60 or over.
Employment Status
Figure 3 shows the percentage of participants by their self-reported employment status at intake. It includes four status categories. The “unemployed for 27 or more weeks” category is a new category and represents a barrier to unemployment defined in the Workforce Innovation and Opportunity Act (WIOA): long-term unemployed. How does this chart reflect or diverge from the economic realities in your program area?
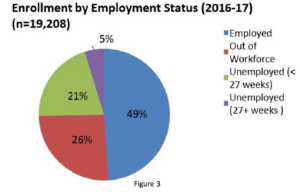
How to read this chart: Forty-nine percent of participants reported that they were employed at intake, 26 percent reported that they were out of the workforce, 21 percent reported that they were unemployed less than 27 weeks, and 5 percent reported that they were unemployed 27 or more weeks.
Performance
Figure 4 displays measurable skill gain (MSG) attainment by program type. The red horizontal line is set at 42 percent. That is our statewide performance target, set in negotiations with the federal Department of Education and published in the Combined State Plan. This chart shows that only the ESL program overall achieved the statewide target; ABE and ASE performance were well below target. What were the performance percentages reported by your class or program last year? How could you raise performance levels? What are factors that prevent students from demonstrating progress – and how can we address them?
Watch for future columns that disaggregate this data further and delve more deeply into regional differences. We look forward to working together to find ways to use data for program improvement.
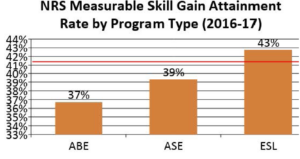
How to read this chart: Thirty-seven percent of participants who entered an adult education program at the ABE level demonstrated an MSG, 39 percent of participants at the ASE level demonstrated an MSG, and 43 percent of participants at the ESL level demonstrated an MSG.
Heidi Silver-Pacuilla is Adult Education Coordinator at the Office of Career, Technical, and Adult Education in the Virginia Department of Education (VDOE). Thomas Suh is the Adult Education Data Collection, Reporting, and Accountability Specialist at VDOE.